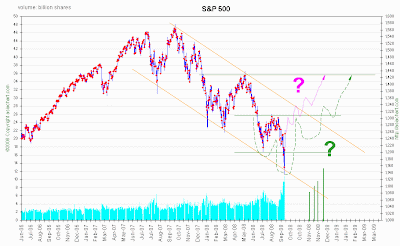

20th September: Two interesting signals last week. First, the NYA touched an important long term support at around 7,400. I wasn't expecting this so soon. But perhaps the sooner the better. See the ninth chart below. It shows a turn on a very good support. Best case scenario would be another fall to that support and a double bottom forming over the next few months. A similar bottom reversed the market in 2003. By contrast the Dow and the S&P500 don't show anything very interesting.
The other interesting thing is 3-day collection of new lows in the 1000 range. On three previous occasions the market has made short term reversals when new lows exceeded new highs by 1000 stocks. Previously we have seen the market rebound after a 1000-new low session. With luck, the recent three-day spike of new lows in the region of 1000 will precipitate more than a mere short term reversal.
In other news, the XOI chart, representing most of the oil majors, merely pulled back to a menacing top.
Hong Kong
20th September: The index plunged to support at around 16,000 before rebounding sharply. The weekly chart shows the index ending flat for the week. But many blue chips indicate that there is still a danger of further falls for the market. What does that mean for the market? (Sign up for my seminar and find out!)
Current prediction
Long term: Weekly chart head and shoulders top points to (log) 14,600; (arithmetic): 11,750 - not yet confirmed
Japan
 20th September: The index has reached our log target. Support on the weekly chart at 12,200 is broken. The trend is still bearish.
Current prediction
Long term: double top (daily) points to 11,200 - done (log), 10,300 (arithmetic)
Malaysia
20th September: The index is testing good support at around 1,000. The top suggests that the support will break.
Current prediction
Medium term: 1. head and shoulders top daily chart points to 910 (log), 830 (arithmetic)
2. head and shoulders top weekly chart points to 930 (log), 860 (arithmetic)
Singapore

20th September: The index has reached log target for our tops in the daily and weekly charts. But there is nothing to suggest that the bearish trend has reversed.
India
 20th September: The index turned on support at 12,500. Let's see if it holds.
 Current prediction:
Medium term: double top points to 10,500 (log); 8,800 (arithmetic)


No comments:
Post a Comment